
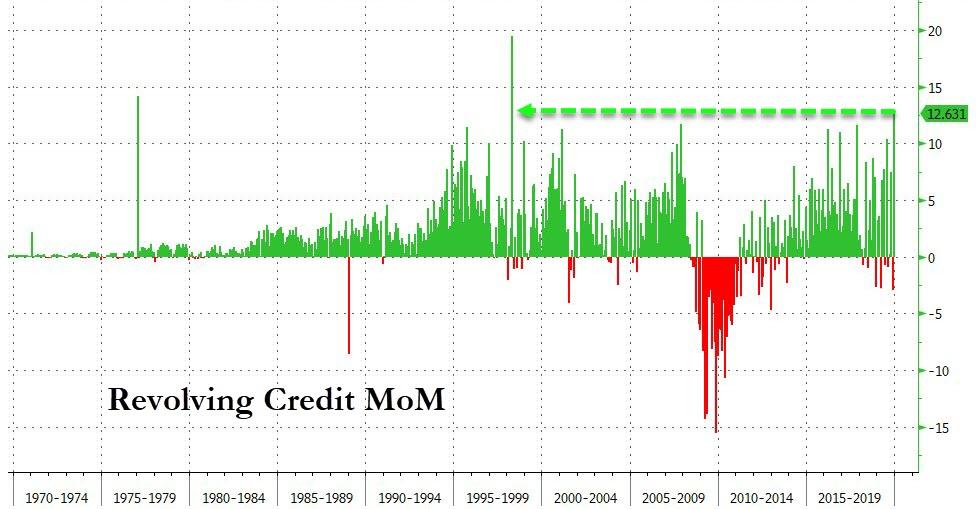
The major economic releases from the past week included the Employment Situation Summary for January from the Bureau of Labor Statistics and four December reports that included metrics which were either estimated or included in last week’s release of 4th quarter GDP: the Commerce Dept’s report on our International Trade for December, the December report on Construction Spending, the Full Report on Manufacturers’ Shipments, Inventories and Orders for June, and the December report on Wholesale Trade, Sales and Inventories with all of those from the Census Bureau…in addition, the Fed released the Consumer Credit Report for January, which showed that overall consumer credit, a measure of non-real estate debt, expanded by a seasonally adjusted $22.0 billion, or at a 6.3% annual rate, as non-revolving credit expanded at a 3.7% annual rate to $3,099.1 billion and revolving credit outstanding expanded at a 14.0% rate to $1,098.0 billion, the largest one month increase in credit card debt in over 21 years..
The week’s privately issued reports included the ADP Employment Report for January, the light vehicle sales report for January from Wards Automotive, which estimated that vehicles sold at a 16.84 million annual rate in January, up from the 16.70 million annual rate reported in December, and up from the 16.60 million annual rate in January a year ago, and both of the widely followed purchasing manager’s survey from the Institute for Supply Management (ISM): the January Manufacturing Report On Business indicated that the manufacturing PMI (Purchasing Managers Index) rose to 50.9% in January, up from 47.2% in December, which suggests a return to very weak expansion among manufacturing firms nationally, while the January Non-Manufacturing Report On Business reported their NMI (non-manufacturing index) rose to 55.5% from 54.9% in December, indicating a slightly larger plurality of service industry purchasing managers reported expansion in various facets of their business in January…
Employers Add 225,000 Jobs in January, Unemployment Rate Rises to 3.6%
The Employment Situation Summary for January from the Bureau of Labor Statistics indicated slightly above average job creation over the month, while the month over month household survey resuls were skewed by the effects of an annual revision…estimates extrapolated from the seasonally adjusted establishment survey data projected that employers added 225,000 jobs in January, after the previously estimated payroll job increase for December was revised up from 145,000 to 147,000, while the payroll jobs increase for November was revised up from 256,000 to 261,000,…that means that this report represents a total of 232,000 more seasonally adjusted payroll jobs than the report of a month ago, somewhat better than the past year’s average monthly gain of 176,000 jobs per month…the unadjusted data, however, shows that there were actually 2,832,000 fewer payroll jobs remaining in January than in December, as the normal post holiday seasonal layoffs in areas such as retail, wholesale, goods transportation, leisure and hospitality were normalized by the seasonal adjustments..
As is usual for the January jobs report, this report included the results of the annual benchmark revision, which revised prior reports and set March 2019 (the benchmark) at 150,282,000 payroll jobs, 514,000 fewer jobs than was previously reported for that month, while job totals for every month in 2019 were concurrently revised downward by magnitudes of between 422,000 and 520,000 per month as well (as is shown in Table A of the press release)…as a result of this revision, 2019 job growth totaled 2,096,000 payroll jobs, down a bit from the previously published total of 2,108,000, while job growth in earlier years was revised lower as well…since all the newly revised figures are now incorporated into this month’s report as if previously reported totals had never been reported, that’s the way we’ll cover it…
Seasonally adjusted job increases in January were spread through construction, the private service sectors and government, while employment in manufacturing was down by 12,000 on a loss of 10,600 jobs in the automotive sector and retail sales saw a seasonally adjusted decrease of 8,300 jobs…meanwhile, 47,200 jobs were added in health care and social assistance, as 9,700 more employees were added by hospitals and 11,300 more were employed by individual and family services…after seasonal adjustments, 44,000 jobs were added in construction, with 35,000 of those working for specialty trade contractors, with those job increases split between both nonresidential and residential specialty trade contractors…also after seasonal adjustments, employment in the leisure and hospitality sector increased by 36,000 jobs over the month, with the addition of 24,400 more jobs in bars and restaurants and 10,000 more working in amusements, gambling, and recreation…employment in transportation and warehousing increased by 28,300, with the addition of 14,300 couriers and messengers and 5,700 working in warehousing and storage…in addition, private educational services added 24,900 jobs, with no itemized breakdown for those jobs….the broad professional and business services sector added 21,000 jobs, led by a 7,000 job increase in computer systems design and related services….19,000 jobs were also added in the government sector, with 14,500 of those added by local governments not including education….meanwhile, employment in the other major sectors, including mining, wholesale trade, utilities, financial activities and information, all saw smaller job gains over the month..
The establishment survey also showed that average hourly pay for all employees rose by 7 cents an hour to $28.44 an hour in January, after it had increased by 3 cents an hour in December; at the same time, the average hourly earnings of production and non-supervisory employees increased by 3 cents to $23.87 an hour…employers also reported that the average workweek for all private payroll employees was unchanged at 34.3 hours in January, while hours for production and non-supervisory personnel increased by 0.1 hour 33.6 hours…however, the manufacturing workweek was unchanged at 40.8 hours, while average factory overtime was down by 0.1 hour to 3.1 hours…
Meanwhile, the January household survey indicated that the seasonally adjusted extrapolation of those who reported being employed fell by an estimated 89,000 to 158,714,000, while the estimated number of those unemployed rose by 139,000 to 5,892,000; which led to a 50,000 increase in the total labor force…however, those numbers were skewed as the benchmark revision to the civilian noninstitutional population showed that December’s population had been overstated by 811,000, which meant that the population dependent metrics all had to be adjusted for that revision….with a January population increase of 132,000 on top of that, that revision meant the number of employment aged individuals who were not in the labor force increased to 94,896,000, the labor force participation rate rose from 63.2.to 63.4%, and the employment to population ratio, which we could think of as an employment rate, rose from 61.0 in December to 61.2% in January…..at the same time, the increase in the number unemployed was large enough to increase the unemployment rate, as rose from 3.5 to 3.6%…in addition, the number of those who reported they were forced to accept just part time work rose by 32,000, from 4,148,000 in December to 4,182,000 in January, which was enough to increase the alternative measure of unemployment, U-6, which includes those “employed part time for economic reasons”, from 6.7% of the labor force in December to 6.9% in January…
Like most reports from the Bureau of Labor Statistics, the employment situation press release itself is easy to read and understand, so you can get more details on these two reports from there…note that almost every paragraph in that release points to one or more of the tables that are linked to on the bottom of the release, and those tables are also on a separate html page here that you can open it along side of the press release to avoid the need to scroll up and down the page to view the tables you want to see..
December Trade Deficit Up 11.9% After Deficits for Prior Months are Revised Higher
Our trade deficit jumped 11.9% in December as the value of both our exports and our imports increased, but our imports increased by much more….the Census report on our international trade in goods and services for December indicated that our seasonally adjusted goods and services trade deficit rose by $5.2 billion to $48.9 billion in December from a revised November deficit of $43.7 billion ….the value of our December exports rose by a rounded $1.6 billion to $209.6 billion on a $1.3 billion increase to $137.7 billion in our exports of goods and an increase of $0.3 billion to $71.9 billion in our exports of services, while the value of our imports rose by a rounded $6.8 billion to $258.5 billion on a $6.4 billion increase to $207.5 billion in our imports of goods, and a $0.4 billion increase to $51.1 billion in our imports of services…the November trade deficit was revised from the originally reported $43.3 billion to $43.7 billion, while the seasonally adjusted goods data for every prior month of 2019 were revised as well, which obviously means that previously published quarter over quarter figures for GDP should be revised as well…the revised figures now show that this year’s trade deficit decreased $10.9 billion, or 1.7 percent, from 2018, on a $1.5 billion decrease in exports and a 12.5 billion decrease in imports, December’s jump notwithstanding….export prices were on average 0.2% lower in December, which means the relative real increase in exports for the month was greater than the nominal increase by that percentage, while import prices averaged 0.3% higher, meaning the increase in real imports was smaller than the nominal dollar decrease reported here by that percentage…
The $1.3 billion increase in our December exports of goods largely resulted from greater exports of industrial supplies and materials and of “other” goods, which was partially offset by lower exports of automotive vehicles, parts, and engines…referencing the Full Release and Tables for December (pdf), in Exhibit 7 we find that our exports of industrial supplies and materials rose by $1,705 million to $46,035 million on a $1,543 million increase in our exports of crude oil, a $534 million increase in our exports of fuel oil, and a $236 million increase in our exports of natural gas, and that our exports of those goods not categorized by end use rose by $996 million to $6,425 million…in addition, our exports of capital goods rose by $153 million to $45,396 million as a $1060 million increase in our exports of civilian aircraft and a $240 million increase in our exports of semiconductors was mostly offset by a $562 million decrease in our exports of drilling & oilfield equipment, a $252 million decrease in our exports of medical equipment, and a $211 million decrease in our exports of parts for civilian aircraft, while our exports of foods, feeds and beverages rose by $79 million to $10,465 million…partly offsetting the increases in those export categories, our exports of automotive vehicles, parts, and engines fell by $1040 million to $12,370 million on a $614 million decrease in our exports of new and used passenger automobiles and a $614 million decrease in our exports of automotive parts other than engines, chassis, and tires, and our exports of consumer goods fell by $614 million to $16,454 million on a $493 million decrease in our exports of jewelry and a $321 million decrease in our exports of pharmaceutical preparations….
Exhibit 8 in the Full Release and Tables gives us seasonally adjusted details on our goods imports and shows greater imports of industrial supplies and materials and of “other” goods accounted for a large part of our $6.4 billion increase in imports… our imports of industrial supplies and materials rose by $3973 million to $44,888 million on a $1,747 million increase in our imports of crude oil, a $906 million increase in our imports of non-monetary gold, a $626 million increase in our imports of petroleum products other than fuel oil, a $346 million increase in our imports of precious metals other than gold, a $218 million increase in our imports of iron and steel mill products, and a $201 million increase in our imports of fuel oil, which were slightly offset by a $322 million decrease in our imports of organic chemicals, and a $239 million decrease in our imports of coal and related fuels, while our imports of goods not categorized by end use rose by $996 million to $6,425 million….in addition, our imports of consumer goods rose by $655 million to $51,897 million on a $502 million increase in our imports of cellphones and a $217 million increase in our imports of toys, games, and sporting goods which were partially offset by a $217 million decrease in our imports of art, antiques and other collectibles, and our imports of capital goods rose by $645 million to $56,050 million as a $564 million increase in our imports of semiconductors, a $328 million increase in our imports of computers, and a $200 million increase in our imports of medicinal equipment was partly offset by a $310 million decrease in our imports of industrial machines not itemized separately, a $300 million decrease in our imports of excavating machinery, and a $222 million decrease in our imports of industrial engines, while our imports of foods, feeds, and beverages rose by $55 million to $12,288 million on increases in imports of several food items….only slightly offsetting increases in those import categories, our imports of automotive vehicles, parts and engines fell by $293 million to $29,777 million as a $372 million decrease in our imports of automotive parts other than engines, chassis, and tires was partially offset by a $269 million increase in our imports of trucks, buses, and special purpose vehicles…
The Full Release and Tables pdf for this month’s report also summarizes Exhibit 19, which gives us surplus and deficit details on our goods trade with selected countries:
The December figures show surpluses, in billions of dollars, with South and Central America ($4.6), Hong Kong ($1.9), Brazil ($0.9), OPEC ($0.7), United Kingdom ($0.6), Singapore ($0.5), and Saudi Arabia ($0.3). Deficits were recorded, in billions of dollars, with China ($25.7), European Union ($14.0), Mexico ($9.4), Germany ($5.5), Japan ($4.4), Canada ($4.4), Italy ($2.9), Taiwan ($2.4), South Korea ($1.9), India ($1.7), and France ($0.3).
- • The deficit with Canada increased $2.4 billion to $4.4 billion in December. Exports increased $0.1 billion to $23.9 billion and imports increased $2.5 billion to $28.2 billion.
- • The deficit with Mexico increased $0.9 billion to $9.4 billion in December. Exports decreased $0.6 billion to $20.2 billion and imports increased $0.3 billion to $29.6 billion.
- • The deficit with Japan decreased $1.3 billion to $4.4 billion in December. Exports increased $0.9 billion to $6.7 billion and imports decreased $0.4 billion to $11.1 billion.
In the advance estimate of 4th quarter GDP published last week, our December trade deficit was estimated based on the sketchy Advance Report on our International Trade in Goods which was released just before the GDP release…that report estimated that our seasonally adjusted December goods trade deficit was at $68,332 million on a Census basis, on goods exports of $136,983 million and goods imports of $205,315 million…this report revises that and shows that our actual Census basis goods trade deficit in December was at $68,671 million, on adjusted goods imports of $205,816 million and adjusted goods exports of $137,144 million…at the same time, the November goods trade deficit was revised up from the $62,988 million indicated in that advance report by nearly $1 billion to $63,728 million, and the October goods trade deficit was revised up from $66,693 million to $67,122 million…those revisions from the previously published figures would suggest that the 4th quarter trade deficit in goods was roughly $1.508 billion more than was accounted for in last week’s GDP report, or more than $6.0 billion greater on an annualized basis, which would subtract about 0.10 percentage points from 4th quarter GDP when the 2nd estimate is released at the end of this month….
Note that trade in goods for July, August, September and October, which all go into figuring the change in 4th quarter GDP, were also revised with this report as well, and since our GDP growth is a measure of the change from one quarter to the next, we should also be adjusting for changes in those months as well to get an accurate 4th quarter read…however, the BEA will not revise 3rd quarter GDP figures until the annual revision this coming summer, so the 4th quarter GDP report that will be published at the end of March will not reflect the revised 3rd quarter trade figures included herein…however, since this month’s revisions are due to changes in the seasonal adjustments, the net trade deficit for the entirety of 2019 should not be affected…
Construction Spending Fell 0.2% in December after Prior Months Were Revised Higher
The Census Bureau’s report on construction spending for December (pdf) estimated that the month’s seasonally adjusted construction spending would work out to $1,327.7 billion annually if extrapolated over an entire year, which was 0.2 percent (± 0.8 percent)* below the revised November estimate of a $1,329.9 billion rate annually, but still 5.0 percent (±1.3 percent) above the estimated annualized level of construction spending in December of last year…the annualized November construction spending estimate was revised 0.4% higher, from $1,324.1 billion to $1,329.9 billion, and the annual rate of construction spending for October was revised 0.3% higher, from $1,316.8 billion to $1,320.8 billion…for all of 2019, construction spending totaled $1,303.5 billion, 0.3 percent (±1.0 percent) above the $1,307.2 billion spent in 2018…
A further breakdown of the different subsets of construction spending is provided in a Census summary, which precedes the detailed spreadsheets:
- Private Construction: Spending on private construction was at a seasonally adjusted annual rate of $991.2 billion, 0.1 percent (±0.5 percent)* below the revised November estimate of $992.2 billion. Residential construction was at a seasonally adjusted annual rate of $540.7 billion in December, 1.4 percent (±1.3 percent) above the revised November estimate of $533.3 billion. Nonresidential construction was at a seasonally adjusted annual rate of $450.5 billion in December, 1.8 percent (±0.5 percent) below the revised November estimate of $458.9 billion. The value of private construction in 2019 was $974.7 billion, 2.5 percent (±1.0 percent) below the $1,000.2 billion spent in 2018. Residential construction in 2019 was $514.3 billion, 4.7 percent (±2.1 percent) below the 2018 figure of $539.6 billion and nonresidential construction was $460.4 billion, virtually unchanged from (±1.0 percent)* the $460.5 billion in 2018.
- Public Construction: In December, the estimated seasonally adjusted annual rate of public construction spending was $336.4 billion, 0.4 percent (±1.3 percent)* below the revised November estimate of $337.7 billion. Educational construction was at a seasonally adjusted annual rate of $80.4 billion, 2.1 percent (±2.1 percent)* below the revised November estimate of $82.1 billion. Highway construction was at a seasonally adjusted annual rate of $99.9 billion, 3.1 percent (±3.1 percent)* above the revised November estimate of $96.9 billion. The value of public construction in 2019 was $328.8 billion, 7.1 percent (±1.8 percent) above the $307.1 billion spent in 2018. Educational construction in 2019 was $79.0 billion, 3.4 percent (±3.6 percent)* above the 2018 figure of $76.4 billion and highway construction was $98.8 billion, 8.8 percent (±4.6 percent) above the $90.8 billion in 2018.
Construction spending for December was higher than was reported by the BEA in their advance estimate of 4th quarter GDP last week, while October’s and November’s annualized construction spending were revised $4.0 and $5.8 billion higher respectively…The BEA’s key source data and assumptions (xls) accompanying last week’s 4th quarter GDP report indicates that they had estimated that December’s residential construction would increase by an annualized $5.8 billion from previously published figures, that nonresidential construction would decrease by an annualized $2.4 billion from last month’s report, and that December’s public construction would decrease by an annualized $1.3 billion from last month’s report….totaling those changes, the BEA had estimated December construction spending to be $2.1 higher than previously reported November levels, which have now been revised $5.8 billion higher…since this report indicated that total construction spending for December was $2.2 billion lower than the revised November figure, that means the net of the annualized construction figures used for December in the GDP report was $1.5 billion too low…averaging the differences between the annual rates in this report and those used in the GDP report for the three months of the 4th quarter would mean that this report suggests that construction spending in the 4th quarter GDP report was underestimated by $3.7 billion (at an annual rate), implying a downward revision to GDP components at a rate that should result in addition of 0.07 or 0.08 percentage points to 4th quarter GDP when the 2nd estimate is released at the end of the month…
Factory Shipments and Factory Inventories Both Up 0.5% in December
The Full Report on Manufacturers’ Shipments, Inventories, & Orders (pdf) for December from the Census Bureau reported that the seasonally adjusted value of new orders for manufactured goods increased by $8.6 billion or 1.8 percent to $499.3 billion in December, following a decrease of 1.2% to $490.7 billion in November, which was revised from the 0.7% decrease to $493.0 billion that was reported for November a month ago….however, since the Census Bureau does not even collect orders data on non durable goods for this widely watched “factory orders report”, both the “new orders” and “unfilled orders” sections of this report are really only useful as revised updates to the December advance report on durable goods which was released last week…on those durable goods revisions, the Census Bureau’s own summary, which precedes their detailed spreadsheet of the metrics included in this report, is quite clear and complete, so we’ll just quote directly from that summary here:
- Summary: New orders for manufactured goods in December, up two of the last three months, increased $8.6 billion or 1.8 percent to $499.3 billion, the U.S. Census Bureau reported today. This followed a 1.2 percent November decrease. Shipments, up three consecutive months, increased $2.3 billion or 0.5 percent to $504.1 billion. This followed a 0.3 percent November increase. Unfilled orders, down three of the last four months, decreased $0.6 billion or virtually unchanged to $1,156.2 billion. This followed a 0.6 percent November decrease. The unfilled orders-to-shipments ratio was 6.65, down from 6.66 in November. Inventories, up twelve of the last thirteen months, increased $3.5 billion or 0.5 percent to $704.9 billion. This followed a 0.3 percent November increase. The inventories-to-shipments ratio was 1.40, unchanged from November.
- New orders for manufactured durable goods in December, up two of the last three months, increased $5.9 billion or 2.4 percent to $245.6 billion, unchanged from the previously published increase. This followed a 3.1 percent November decrease. Transportation equipment, up following three consecutive monthly decreases, drove the increase, $6.1 billion or 7.9 percent to $83.2 billion. New orders for manufactured nondurable goods increased $2.8 billion or 1.1 percent to $253.8 billion.
- Shipments of manufactured durable goods in December, down six consecutive months, decreased $0.5 billion or 0.2 percent to $250.3 billion, unchanged from the previously published decrease. This followed a 0.2 percent November decrease. Transportation equipment, also down six consecutive months, led the decrease, $0.3 billion or 0.4 percent to $83.3 billion. Shipments of manufactured nondurable goods, up three consecutive months, increased $2.8 billion or 1.1 percent to $253.8 billion. This followed a 0.7 percent November increase. Petroleum and coal products, up five of the last six months, led the increase, $2.4 billion or 4.5 percent to $56.3 billion.
- Unfilled orders for manufactured durable goods in December, down three of the last four months, decreased $0.6 billion or virtually unchanged to $1,156.2 billion, up from the previously published 0.1 percent decrease. This followed a 0.6 percent November decrease. Machinery, down fourteen consecutive months, led the decrease, $0.4 billion or 0.4 percent to $101.6 billion.
- Inventories of manufactured durable goods in December, up seventeen of the last eighteen months, increased $2.1 billion or 0.5 percent to $435.9 billion, unchanged from the previously published increase. This followed a 0.4 percent November increase. Transportation equipment, also up seventeen of the last eighteen months, led the increase, $1.7 billion or 1.1 percent to $151.2 billion. Inventories of manufactured nondurable goods, up two consecutive months, increased $1.4 billion or 0.5 percent to $269.0 billion. This followed a 0.2 percent November increase. Petroleum and coal products, up three consecutive months, led the increase, $1.0 billion or 2.5 percent to $40.8 billion. By stage of fabrication, December materials and supplies decreased 0.3 percent in durable goods and increased 0.5 percent in nondurable goods. Work in process increased 1.5 percent in durable goods and decreased 0.3 percent in nondurable goods. Finished goods were virtually unchanged in durable goods and increased 0.9 percent in nondurable goods.
The BEA’s key source data and assumptions (xls) for 4th quarter GDP indicates that they had estimated that the value of non-durable goods inventories would increase by $0.6 billion on a Census basis in December before they estimated the 4th quarter’s output, so the actual $1.4 billion increase would indicate that they underestimated the end of 4th quarter GDP inventory component by about $0.8 billion, or by ~$3.2 billion on an annualized basis, which would suggest that 4th quarter GDP would have to be revised upwards by about 0.05 or 0.06 percentage points to account for what this report shows..
December Wholesale Sales Down 0.7% After November Sales Revised 0.6% Lower; Inventories Down 0.2%
The December report on Wholesale Trade, Sales and Inventories (pdf) from the Census Bureau estimated that the seasonally adjusted value of wholesale sales was at $494.4 billion, down 0.7 percent (+/-0.4%) from the revised November level, but up 0.5 percent (±1.1 percent)* from wholesale sales of December 2018… the November preliminary estimate was revised down $3.0 billion or 0.6% to $497.7 billion from the $500.7 billion in sales reported last month, which is now 0.9% more than October sales, rather than a 1.5% increase…as an intermediate activity, wholesale sales are not included in GDP except insofar as they are a trade service, since the traded goods themselves do not represent an increase in the output of the goods produced or finally sold….
On the other hand, the monthly change in private inventories is a major factor in GDP, as additional goods on the shelf or in intermediate storage represent goods that were produced but not sold, and this December report estimated that wholesale inventories were valued at a seasonally adjusted $674.5 billion at month end, down 0.2 percent (±0.4 percent)* from the revised November level but 2.1 percent (±1.1 percent) higher than in December a year ago, with the November preliminary estimate revised higher, from $674.9 billion to $675.7 billion at the same time, now a 0.1% increase from October….
In the advance report on 4th quarter GDP of last week, wholesale inventories were estimated based on the sketchy Advance Report on Wholesale and Retail Inventories which was released the day before the GDP release…that report estimated that our seasonally adjusted wholesale inventories were valued at $675.6 billion at the end of December, down from $676.0 billion in November….that’s $1.1 billion more than the $674.5 billion that this report shows, which would imply that the quarterly change in 4th quarter wholesale inventories was overestimated at roughly a $4.4 billion annual rate…assuming there’s no distortion caused by reweighting the inflation adjustments to those inventories, that would mean that the growth rate of 4th quarter GDP was overestimated by around 0.8 percentage points, just based on what this report shows…
