
 probably the most interesting report out this past week was that on March consumer credit from the Fed…you might recall we started following this with last november’s report, when after months of modest month over month increases, it suddenly spiked 9.9%, and subsequently we determined that almost the entirety of these recent increases was as a result of borrowing from the federal government for student loans, which has been growing at a compound annualized growth rate of 56%…this week we had yet another spike in consumer borrowing, a 10.2% annualized increase, which was the biggest jump in borrowing since November 2001 (note: this report does not include home loans)…and although student loan borrowing continued to contribute to the outstanding credit increase, what was notable in March was a sudden increase of 7.8% in revolving credit (credit cards), which had decreased in january & february and had been trending down over most of the last three years…let’s break it down: you can see in the first table on the Fed report that total credit outstanding increased $21.3 billion, or at a 10.2% annualized rate, to $2.542 trillion; of that, revolving credit was up $5.2 billion to $803.6 billion, and non revolving credit, which includes longer term loans for cars, yachts, & education, rose $16.2 billion to $1.739 trillion…the monthly change in revolving credit is represented by the blue bar portion in the adjacent graph from zero hedge, the non-revolving change is in red, and the net annualized monthly change is represented by the black line…as we know that most of the revolving credit is credit cards, lets see what the makeup of the non-revolving credit is by scrolling to the last table in the Fed report, headed “major types of credit, by holder”; you can easily see that borrowing from commercial banks and finance companies was up by less than 1%, and borrowing from credit unions was down; so again, the only non-revolving consumer credit outstanding that was up substantially was that from the federal government, which rose to $460.2 billion in March from $453.3 billion in february…yet this credit surge was widely reported in the media – even the financial times – as also being driven by a surge in auto loans, which might be a clue that the financial reporters aren’t digging too deeply…
while we’re mentioning federal student loans, we should take note of the debate that took place, and went nowhere, in the senate this week…first, some background; in 2007, when the interest rate on federally subsidized student loans was at 6.8%, congress passed a bill to cut that rate in half to reduce the burden on young people wanting to go to college; however, the Act had just a five year window and it expires July 1st…so unless that Act is extended, the 7.4 million students who are currently paying on student loans will see their interest rate double…the hitch, however, is that under rules of the budget control act, everything congress does must now be “paid for”; the Senate democrats proposed to do that by closing tax loopholes for partnerships and S Corps; the republicans countered with a proposal to eliminate a preventive health program that was part of obamacare; although the vote was 52-45 in favor of starting debate on the Democratic legislation, it was short of the 60 votes needed, and there’s no sign of a compromise…a similar debate looms over the expiration of the temporary forbearance on taxes on mortgage debt forgiven in home loan modifications…you might recall that prior to 2007, any cancelled debt or loan forgiveness had to be reported as income and was taxed; in 2007, in the face of declining home prices, congress passed a “mortgage debt forgiveness act” which ensured that those who took a loss on their homes wouldnt have to pay taxes on their loss…however, that act expires at the end of this year, and since bank of america has already begun to modify home loans by reducing a portion of the principal balance on mortgages under the provisions of the mortgage fraud settlement, those who have their home loans reduced may well face a tax bill on the amounts forgiven…conservatives in congress have already voiced opposition to a bailout of homeowners, so what would seem the logical move to extend this debt forgiveness will likely to turn into another protracted battle…
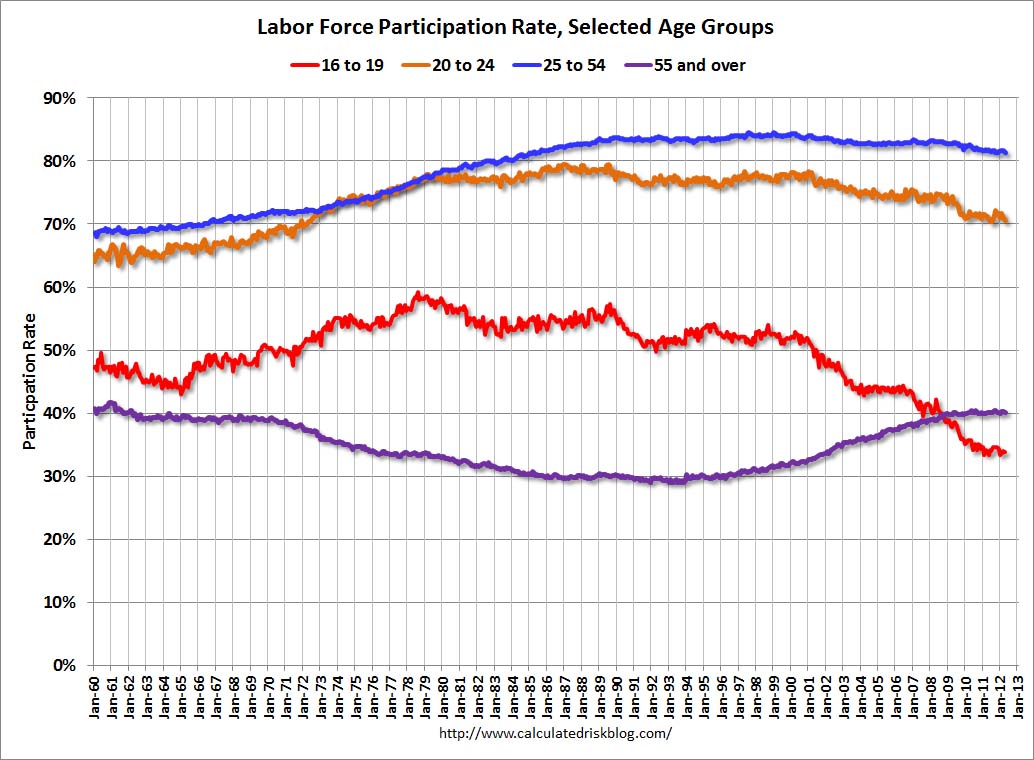
 after last week’s unemployment report showed the massive increase in the numbers of those considered “not in the labor force” – over half a million – and the record lowest labor force participation rate in over 3 decades, a number of economists & analysts went beyond the normal one line writeoff of those who dont count in an attempt to discover the makeup of that large part of the population who had somehow been slipping through the cracks…those who’ve tried to play down the severity of the unemployment situation have usually dismissed the non-partcipants as mostly due to increases in newly retired baby boomers and young people going back to school, so a number of bloggers attempted to deconstruct the figures to see who it was that made up that record 88,419,000 of us who were either non-participants due to their own choice, or who had dropped out of the labor force due to market conditions…were going to look at a few of those, and a few graphs from them, and see if we can put together a cohesive picture of what’s going on…we’ll start with a few graphs from a post by bill mcbride at calculated risk, who himself was responding to other posts in the blogosphere, and specifically to one by catherine rampell at the NY Times economix blog; this first graph, to the left simply shows the labor force participation rate by age group; you can see that teenager participation in red has been in a long decline since 2000 & before, falling most recently to near 33%; similarly, young adult participation in orange has been declining, but not as severely…but the participation rate of the over 55 contingent in purple started growing in the mid 1990s and continued to grow throughout the recession; holding at over 40% throughout; the chart to the right shows it’s not just the old boomers who are working longer; all of the 5 year groupings of elderly are showing increasing participation, but especially those older than boomers, those 65-69 (purple) and 70 to 74 (teal)…and according to projections by BLS economist Mitra Toossi, graphed in that same post, participation rates for every age group over 55 are expected to accelerate even more over the next decade…
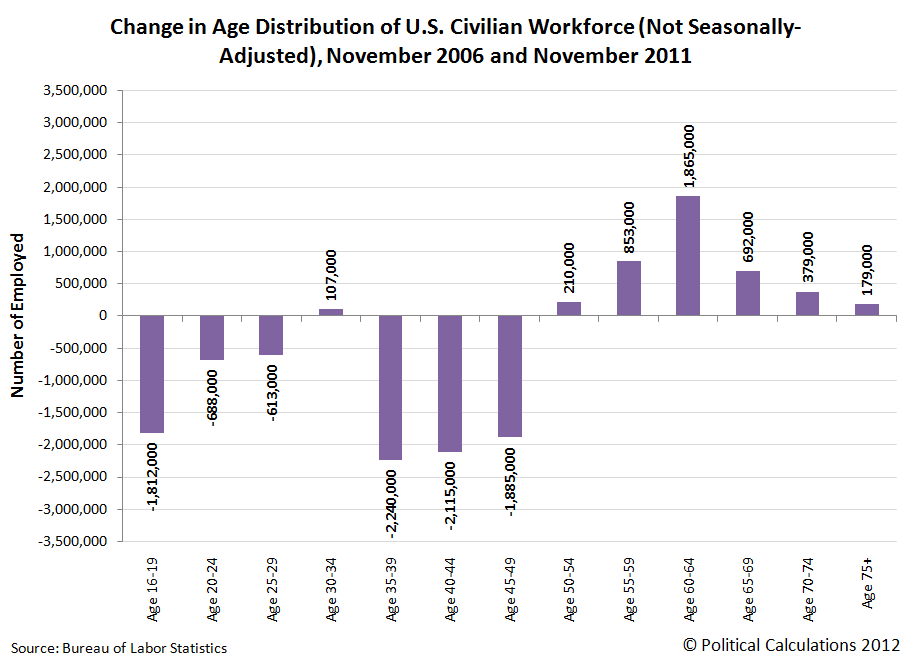
next we’re going to look at a chart from ‘ironman’ at political calculations, from part two of his 3 post series “Are Baby Boomers Stealing Jobs from the Young?”; but rather than those “not in the labor force”, he’s showing the change in the civilian workforce (those who DO count) between november 2006 (chosen to capture the last year of expansion) and november 2011 (chosen to eliminate seasonality); here again we see increases in all the age groups over 50, greatest in the old boomers 60-64, the big decrease in teens & young adults in the civilian workforce, but even clearer is the picture that most of the decreases in the workforce in this recession are in the age groups 35-39, 40-44, & 45-49…so, without even asking why those who arent in the labor force have dropped out, it seems fairly clear just from these demographic charts that the decline in the labor force participation rate is not being caused by a sudden wave of early retirements; but on the other hand, with the long term trend of less participation by those younger than 25, there seems to be a strong likelihood that young people may be staying in school longer, and possibly borrowing to do so…but there is nothing yet to suggest a permanent change to the labor force participation rate or the employed to population ratios caused by changes in demographics; rather, we see that almost all of those not employed now are at an age where they’d be expected to be employed in the future…
there were other posts this week that attempted to unravel labor force participation from angles other than age demographics; in the aforementioned post by catherine rampell, she charts all adults in prime working years, finds the recession-related decline in overall LFPR, but then notes a decline in participation rate by men that seems to have started in the 50s, when 98% of men aged 25-54 were in the labor force, to the present male participation rate of 88%; on the other hand, new deal editor bryce covert, writing at the nation and citing a kansas city Fed paper covered in a long post on LFPR by Rortybomb’s Mike Konczal, says the recession has been pushing women out of the labor force (because the trend for men to quit working was already underway); in the second of two posts on LFPR at Atlanta Fed’s macroblog, research economist julie hotchkiss looks at the actual responses people give to the BLS household survey as to why they are no longer looking for work; she finds only 1.1% of responses are the widely touted “discouraged workers”; 41% had looked for work during the preceding year but not during the reference month, and the rest were nonparticipants because of retirement, disability, going to school, caring for household members, or other reasons (her 12/97 to 6/11 chart of those dropouts aged 25-54 is to the left)…also, Mish noted a 2.2 million increase in disability claims and said disability fraud explains the falling unemployment rate, and American Enterprise Institute economist mark perry says there’s less there than meets the eye; move right along, it’s mostly demographics…
for a summary of this week’s other economic reports not covered above, including the march trade deficit with 2 charts, see bill mcbride’s summary at calculated risk; he also notes a seasonal 0.6% month-over-month increase in the March CoreLogic home price index, but neglects to mention that the LPS home price index also rose month over month by 0.2% on sales volume 30% lower than any month since 1998; although the LPS report is only for february, it roughly corresponds to the CoreLogic three month report for march…
(the above is my weekly commentary that accompanied my sunday morning links mailing, which in turn was mostly selected from my weekly blog post on the global glass onion, and also includes other links of interest…if you’d be interested in getting my weekly emailing of selected links that accompanies these commentaries, most coming from the aforementioned GGO posts, contact me…)
