
the four macroeconomically important reports released this past week — retail sales for December and business inventories for November from the Census bureau, Industrial Production for December from the Fed, and the Producer Price Index for December from the BLS — were all released on Friday, leaving us little time to take a detailed look at them before writing about them today.…Friday also saw the release of the Empire State Manufacturing Survey from the New York Fed, which covered New York and northern New Jersey, and which reported their headline general business conditions index fell from -4.6 to -19.4, its lowest level since 2009 and sixth negative monthly index reading in a row, indicating a worsening recession in First District manufacturing…other reports released earlier in the week included the Import and Export Price Indexes for December, the Job Openings and Labor Turnover Survey (JOLTS) for November, and the Mortgage Monitor for November (pdf) from Black Knight Financial Services, which we’ll also take a look at today…
December Retail Sales Unchanged from November Report
seasonally adjusted retail sales fell 0.1% in December after retail sales for November were revised 0.1% higher, as this month’s sales figure is the same as was published last month…the Advance Retail Sales Report for December (pdf) from the Census Bureau estimated that our seasonally adjusted retail and food services sales totaled $448.1 billion, which was an decrease of 0.1 percent (±0.5%) from November’s revised sales of $448.6 billion and 2.2 percent (±0.7%) above the sales of December of last year…November’s seasonally adjusted sales were revised from the $448.1 billion first reported to $448.6 billion, while October’s sales, which were revised down to $447.1 billion from the originally reported $447.3 billion last month, were revised down again, to $446.929 billion with this report…estimated unadjusted sales, extrapolated from surveys of a small sampling of retailers, indicated unadjusted sales rose 15.5%, from $444,581 million in November to $513,757 in December, while they were up 1.5% from the $499,976 million of sales in December a year ago, obviously a large seasonal adjustment to December’s report…while we can’t judge the economic impact of this month’s report until the consumer price index is released next Wednesday, the revision to October and November sales would add about 0.01 percentage point to our previous estimates of the GDP growth rate for those months…
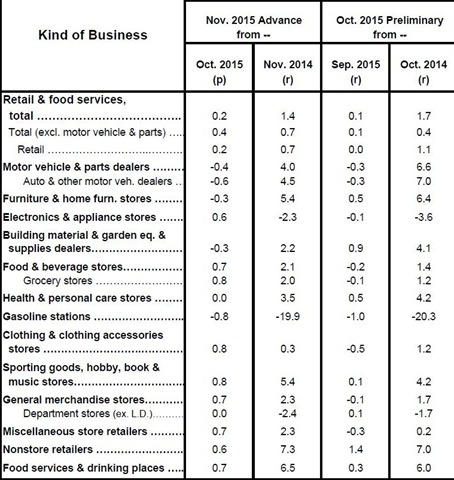
since it’s the end of the quarter for retail sales, we’ll include the entire table from this report showing retail sales by business type, including the quarter over quarter data…again, to explain what it shows, the first double column shows us the seasonally adjusted percentage change in sales for each kind of business from the November revised figure to this month’s December “advance” report in the first sub-column, and then the year over year percentage sales change since last December in the 2nd column; the second double column pair below gives us the revision of the November advance estimates (now called “preliminary”) as of this report, with the new October to November percentage change under “Oct 2015 r” (revised) and the November 2014 to November 2015 percentage change as revised in the 2nd column of the pair….then, the third pair of columns shows the percentage change of the most recent 3 months of this year’s sales (October, November and December) from the preceding three months of the 3rd quarter(July, August and September) and from the same three months (October, November and December) of a year ago….that pair of columns gives us a snapshot comparison of 3rd quarter sales to 4th quarter sales, which will be useful in estimating the impact of this report on 4th quarter GDP after consumer prices for December are published next week…for the table of last month’s advance November estimates before this month’s revision, click here…

note that for the first time in several months, a large swing in automobile sales was not the determining factor of the vector of this months sales…sales at motor vehicle and parts dealers were statistically unchanged at $94,562 million, and hence without those automotive sales, month over month retail sales were still down 0.1%….the major reason for the December decrease, however, is the 1.1% decrease in gas station sales, without which retail sales would have just been down just $98 million, which would be considered statistically unchanged…most of the other changes in December sales are fairly typical; furniture stores and specialty stores, such as sporting goods and bookstores, led with 0.9% increases in sales, while sales at general merchandisers fell 1.0% and clothing stores fell 0.9%, not unexpected for the warmest December on record…note that November sales, in the second set of columns, were revised to indicate a 0.4% increase over October, from the 0.2% increase reported last month; that’s because while November sales were revised 0.1% higher, October sales were revised 0.1% lower…also note in the 5th column, which shows quarter over quarter results, nominal sales were only up 0.2%, while “retail sales” which excludes restaurants and bars from the total, were flat…that portends a weak contribution from consumers to 4th quarter GDP, which we’ll take a more detailed look at next week when consumer prices are released, which will enable us to compute the real change in goods sold at retail…
December Industrial Production Falls 0.4% on Less Heating and Well Drilling
industrial production fell again in December, but once again, half of the drop was due to a much warmer than normal month, reducing the need for heating utilities….the Fed’s G17 release on Industrial production and Capacity Utilization indicated that industrial production fell by 0.4% in December after falling by a revised 0.9% November and 0.2% in October, leaving the index down at a 3.4% annual rate in the 4th quarter and 1.8% below its year ago level…the industrial production index, with the benchmark now set for average 2012 production to equal to 100.0, fell to 106.0 in December from 106.4 in November, which was originally reported at 106.5…meanwhile, the October reading for the index was revised up from 107.1 to 107.4, the September reading for the index was revised up from 107.5 to 107.6, while the August reading was revised down from 106.7 to 106.7….to the extent that this report plays into GDP, the changes in August and September industrial production should be close to a wash on the 3rd quarter’s growth rate, while the weaker 4th quarter index levels imply a major subtraction from 4th quarter growth in those GDP components responsible, especially in such areas as household utilities consumption expenditures…
the manufacturing index was down 0.1 at 106.0 in December, after the index for November was revised down from 106.2 to 106.1, the manufacturing index October was left unchanged at 106.2, the manufacturing index for September was revised from 105.9 to 108.8, and the manufacturing index for August was revised from 106.1 to 106.0…thus, the year over year increase in the manufacturing index has now been reduced to 0.8% from last month’s 0.9%… meanwhile, the mining index, which includes oil and gas well drilling, fell by 0.8% in December after falling a revised 2.1% in November, and at 110.1 it’s now 11.2% below its level of December a year ago…finally, the utility index, which often fluctuates due to above or below normal temperatures, fell by 2.0% in December after a 5.0% drop in November, as the decreases in both months were due to warmer than normal temperatures, reducing the need for heating…at 96.0, the utility index is now 6.0% lower than it was in December a year ago, and at the lowest level since the extraordinarily warm month of March 2012…
this report also gives us capacity utilization figures, which are expressed as the percentage of our plant and equipment that was in use during the month, and which saw total capacity utilization fall from 76.9 in November to 76.5 in December…seasonally adjusted capacity utilization for all manufacturing industries was down 0.1% to 76.0% in December as manufacturing capacity utilization for November was revised down 0.1% to 76.1%…after a downward revision of 0.3% to November’s figure, utilization of NAICS durable goods production facilities were unchanged at 75.8% in December, while capacity utilization for non-durables fell from 77.8% to 77.6% after November’s non-durable utilization was marked down from 77.9%….capacity utilization for mining fell from 79.2% in November to 78.4% in December, while utilities were operating at 73.2% of capacity during December, down from the revised 74.9% in November…for more details on capacity utilization by type of manufacturer, see Table 7: Capacity Utilization: Manufacturing, Mining, and Utilities, which shows the historical capacity utilization figures for a dozen types of durable goods manufacturers, 8 classifications of non-durable manufacturers, mining, utilities, and capacity utilization for a handful of other special categories….
December Producer Prices Down 0.2% On Falling Energy Prices
the seasonally adjusted Producer Price Index (PPI) for Total Final Demand decreased by 0.2% in December as prices for finished wholesale goods fell by 0.7%, while margins of final services providers were 0.1% higher…this followed a November report that showed the overall PPI up 0.3%, with prices for finished goods down 0.1% while final demand for services was up 0.5%….producer prices are now 1.0% lower than they were a year ago, and 0.1% lower than two years ago, as producer prices only rose 0.9% in 2014…
as noted, the index for final demand for goods, aka ‘finished goods’, fell by 0.7% in December after falling 0.1% in November, 0.4% in October, and 1.2% in September, as the index for wholesale energy prices fell 3.4% on an 8.3% drop in the price of wholesale gasoline and accounted for three fourths of the December index drop…in addition, the index for wholesale food prices was down 1.3% on a 38.0% drop in the wholesale price for fresh eggs and a 13.8% drop in wholesale prices for beef and veal…excluding food and energy, the index for final demand for wholesale core goods was 0.1% higher in December, as a 1.1% increase in wholesale prices for pharmaceutical preparations and a 1.0% increase in wholesale prices for printing machinery and equipment were the only core finished goods to see a price change greater than 1% for the month…
meanwhile, the index for final demand for services rose by 0.1% in December after rising 0.5% in November and falling by 0.3% in October and 0.4% in September, as the index for final demand for trade services fell 0.4%, the index for final demand for transportation and warehousing services also fell 0.4%, while the core services index for final demand for services less trade, transportation, and warehousing services was 0.4% higher….noteworthy among trade services, seasonally adjusted margins for TV, video, and photographic equipment and supplies retailers were 27.4% lower and margins for fuels and lubricants retailers were 4.0% lower…among transportation and warehousing services, airlines saw their margins reduced 1.7%, while in the core final demand services index, margins for securities brokerage, dealing, investment advice, and related services rose 9.2%…
this report also showed the price index for processed goods for intermediate demand fell by 1.0% after a 0.6% decrease in November, as intermediate processed goods prices have now been down 15 out of the last 17 months and are 6.4% lower than in December a year ago….all intermediate goods indices were down for the 5th consecutive month, with prices for intermediate energy goods 3.5% lower, the index for processed foods and feeds 2.4% lower, while the price index for processed goods for intermediate demand less food and energy was down 0.4%…meanwhile, the price index for intermediate unprocessed goods fell 3.0% in December after falling 5.1% in November, as all of the raw material indexes also fell, with the index for crude energy goods down 5.6%, the index for unprocessed foodstuffs and feedstuffs down 1.6%, and producer prices for raw materials other than food and energy materials 1.0% lower… this raw materials index is now 25.0% lower than it was a year ago, as most commodity prices continue to hit multi year lows…
finally, the price index for services for intermediate demand was up 0.2% after it was unchanged in November and fell by 0.4% in October and 0.7% in September, as a 1.1% decrease in the index for trade services for intermediate demand was offset by a 0.5% increase in the the price index for services less trade, transportation, and warehousing for intermediate demand, while the index for transportation and warehousing services for intermediate demand was unchanged…within such intermediate services, an 7.7% decrease in margins for metals, minerals, and ores wholesaling was more than offset by a 2.6% increase in margins prices for television advertising time sales and sizable increases in the indexes for services related to securities brokerage and dealing; courier, messenger, and postal services, tax preparation and planning; passenger car rental; and hardware, building materials, and supplies retailing…over the 12 months ended in December, the year over year price index for services for intermediate demand, which has never turned negative, is still 0.5% higher than it was a year ago…
Nominal Business Sales and Business Inventories Both Down 0.2% in November
following the release of the retail sales report, the Census Bureau released the composite Manufacturing and Trade Inventories and Sales report for November (pdf), which incorporates the revised November retail data and gives us a complete picture of the business contribution to the economy for that month…according to the Census Bureau, total manufacturer’s and trade sales were estimated to be valued at a seasonally adjusted 1,313.5 billion in November, down 0.2 percent (±0.2%)* from October’s revised sales, and down 2.8 percent (±0.5%) from November sales of a year earlier…note that total October sales were revised down by more than 0.1%, from $1,317.7 billion to $1,316.0 billion….manufacturer’s sales rose by 0.2% from October’s sales to $475,313 million in November, retail trade sales, which exclude restaurant & bar sales from the revised November retail sales reported earlier, were 0.3% higher at $395,336 million, while wholesale sales fell 1.0% to $442,801 million…
meanwhile, total manufacturer’s and trade inventories, a major component of GDP, were estimated to be valued at a seasonally adjusted $1,809.8 billion at the end of November, down 0.2 percent (±0.1%) from October but 1.6 percent (±0.5%) higher than in November a year earlier…the value of October inventories was also revised down by more than 0.1%, from the $1,814.5 billion reported last month to $1,812.5 billion with this report…seasonally adjusted inventories of manufacturers were estimated to be valued at $641,307 million, 0.3% less than in October, inventories of retailers were valued at $585,554 million, 0.2% greater than October, and inventories of wholesalers were estimated to be valued at $582,907 million at the end of November, down 0.3% from October…last week we reviewed factory and wholesale inventories adjusted for inflation with the producer prices index and judged that both would be detrimental to 4th quarter GDP, with wholesale inventories possibly significantly so…November retail inventories, on the other hand, are still up 0.3% from the end of the 3rd quarter, and will be inflated by the 0.4% and 0.1% decreases in producer prices for finished goods for October and November.. so we’d judge that the 0.8% increase in real retail inventories over two months could add incrementally to 4th quarter GDP, but not enough to offset the negative impact from the real drop in wholesale inventories…
November Job Openings, Hiring and Quitting Up; Layoffs Down
the Job Openings and Labor Turnover Survey (JOLTS) report for November from the Bureau of Labor Statistics estimated that seasonally adjusted job openings rose by 82,000, from 5,349,000 in October to 5,431,000 in November, after October’s job openings were revised from 5,383,000 to 5,349,000, 185,000 lower than September’s….November jobs openings were 11.2% higher than the 4,886,000 job openings reported in November a year ago, as the job opening ratio expressed as a percentage of the employed rose to 3.7% in November from 3.6% in October and from 3.4% a year ago….the broad-professional and business services category saw an increase of 66,000 openings in the largest change, and there were also 57,000 additional openings in health care, while job openings in retail fell by 58,000 (see table 1 for more details)…like most BLS releases, the press release for report is easy to read understand and also refers us to the associated table for the data cited, linked at the end of the release…
the JOLTS release also reports on labor turnover, which consists of hires and job separations, which in turn is further divided into layoffs and discharges, those who quit, and ‘other separations’, which includes retirements and deaths….in November, seasonally adjusted new hires totaled 5,197,000, up 29,000 from the revised 5,168,000 who were hired or rehired in October, as the hiring rate as a percentage of all employed remained unchanged at 3.6%, which was also unchanged from the hiring rate in November a year earlier (details of hiring by industry since June are in table 2)….meanwhile, total separations also rose by 29,000, from 4,901,000 in October to 4,930,000 in November, as the separations rate as a percentage of the employed inched up from 3.4% to 3.5%, which was also higher than the separations rate of 3.3% a year ago (see table 3)…subtracting the 4,930,000 total separations from the total hires of 5,197,000 would imply an increase of 276,000 jobs in November, a bit higher than the revised payroll job increase of 262,000 for November reported by the December establishment survey last week, not an unusual difference and well within the expected margin of error in these incomplete samplings…
breaking down the seasonally adjusted job separations, the BLS finds that 2,831,000 quit their jobs in November, up 47,000 from the revised 2,784,000 who quit their jobs in October, while the quits rate, widely watched as an indicator of worker confidence, was unchanged at 2.0% of total employment (see details in table 4)….in addition to those who quit, another 1,660,000 were either laid off, fired or otherwise discharged in November, down 13,000 from the revised 1,703,000 who were discharged in October, which left the discharges rate unchanged at 1.2% of all those who were employed during the month….meanwhile, other separations, which includes retirements and deaths, were at 409,000 in November, down from 414,000 in October, for an ‘other separations’ rate of 0.3%, which was also unchanged….both seasonally adjusted and unadjusted details by industry and by region on hires and job separations, and on job quits and discharges can be accessed using the links to tables at the bottom of the press release…
Mortgage Delinquencies Rise in November; Mean Time in Foreclosure at Record 1061 Days
the Mortgage Monitor for November (pdf) from Black Knight Financial Services (BKFS, formerly LPS) reported that there were 697,944 home mortgages, or 1.38% of all mortgages outstanding, remaining in the foreclosure process at the end of November, which was down from 721,435, or 1.46% of all active loans that were in foreclosure at the end of October, and down from 1.81% of all mortgages that were in foreclosure in November of last year…these are homeowners who had a foreclosure notice served but whose homes had not yet been seized, and the November “foreclosure inventory” is now showing the lowest percentage of homes that were in the foreclosure process since the fall of 2007… new foreclosure starts, meanwhile, were at their lowest level since April 2006, falling to 66,626 in November from 73,218 in October and from 81,437 in November a year ago, although BKFS cautions there is “some degree of seasonality” in the drop in foreclosure starts, as the month contained two federal holidays (Veterans Day and Thanksgiving Day) and 5 weekends
there was also likely some degree of seasonality in the increase in those who were delinquent on paying their mortgage, as we’ve often seen more homeowners fall behind on house payments during the Christmas shopping months…BKFS data showed that 2,490,817 mortgages, or 4.92% of all mortgage loans, or were at least one mortgage payment overdue but not in foreclosure in November, up from 2,414,583, or 4.77% of all homeowners with a mortgage, who were more than 30 days behind on their mortgage in October…while that was the highest mortgage delinquency rate since February, it’s still down from the mortgage delinquency rate of 6.03% in November a year earlier…of those who were delinquent in November, 827,338 home owners, or 1.64% of those with a mortgage, were considered seriously delinquent, meaning they were more than 90 days behind on mortgage payments, but still not in foreclosure at the end of the month…combining these totals, we find a total of 6.30% of homeowners with a mortgage were either late in paying or in foreclosure at the end of November, and 3.02% of them were in serious trouble, ie, either “seriously delinquent” or already in foreclosure at month end…
the Mortgage Monitor (pdf) is a mostly graphics presentation from what was once the Analytics division of Lender Processing Services that covers a variety of mortgage related issues each month…the first graph we have selected below comes from page 6 of the mortgage monitor and shows the number of new 90 day delinquencies each month, or those who just fallen 90 days behind on their mortgage, as a dark red line over the period from November 2005 to this month’s report…then it shows the number of new foreclosure starts over the same period marked by black bars each month…as you can see, the 90 day delinquencies have increased 27% since March, but they’re still 19% below last year’s November high…in the callout on the graph, BKFS explains that the rise in new 90 day delinquencies over the past several months coupled with the low foreclosure start rate is the reason that the inventory of those who are at least 3 months behind on their mortgage and have not yet been foreclosed on is rising…

understand that the above graph just shows the new 90 day delinquencies, and that the total of all of those who are more than 90 days overdue on their mortgage is much larger (827,338 home owners, as noted in our summary above)…the percentage of those who are seriously delinquent who are being foreclosed on each month can be more clearly seen in the graph below, from page 5 of the mortgage monitor, which shows foreclosure starts as a percentage of 90 day delinquent mortgages tracked in blue…since, as they point out, foreclosure starts as a percentage of 90-day delinquent loans is higher than 2014’s level, a slightly higher percentage of remaining 90 day delinquent loans are being foreclosed on monthly, despite the lower number of foreclosure starts…

lastly, we’ll include below that part of a Mortgage Monitor table showing the monthly count of active home mortgage loans and their delinquency status, which comes from page 13 of the pdf….the columns in the table below show the total active mortgage loan count nationally for each month given, number of mortgages that were delinquent by more than 90 days but not yet in foreclosure, the monthly count of those mortgages that are in the foreclosure process (FC), the total non-current mortgages, including those that just missed one or two payments, and then the number of foreclosure starts for each month over the past and for each January shown going back to January 2005….in the last two columns, we see the average length of time that those who have been more than 90 days delinquent have remained in their homes without foreclosure, and then the average number of days those in foreclosure have been stuck in that process because of the lengthy foreclosure pipelines…the average length of delinquency for those who have been more than 90 days delinquent without foreclosure has been falling from the April record of 536 days and is now at 502 days, while the average time for those who’ve been in foreclosure without a resolution is back to its record high of 1061 days that was set in August, meaning the average homeowner who is in foreclosure has been there nearly three years, which, considering ongoing new foreclosure starts, shows the still slow pace of foreclosures, with some foreclosures started early in the crisis still not yet completed…

(the above is the synopsis that accompanied my regular sunday morning links emailing, which in turn was mostly selected from my weekly blog post on the global glass onion…if you’d be interested in receiving my weekly emailing of selected links, most from the aforementioned GGO posts, contact me…)
