
even before last week’s letter was emailed, it turns out that the White House had already rejected using the trillion dollar coin gimmick widely discussed last week as a method of keeping the government functioning after the debt ceiling was breached…indications were that even if the coin were minted, the Fed would not accept it as a method to circumvent the debt limit and since the White House had already previously ruled out using the 14th amendment as a justification to continue paying the bill for spending already legislated, and since the White House insisted that raising the debt ceiling was not negotiable, the ball was back in congress’s court, where more than half of the republicans indicated they were ready to let the US go into default, which tim geithner suggested could happen as early as February 15th…that brought out questions of who would get paid should the government be forced to operate on revenues alone, which cover just 60% of the budget, but Brad Plumer at the WaPo pointed out how difficult that would be to sort out, since every day the Treasury gets about 2 million invoices from government agencies, which are processed automatically “dozens of times per second”….however, with the likes of paul ryan suggesting that the treasury would have to prioritize spending after the debt limit was hit and Fitch warning that the US’s triple AAA rating was in jeopardy, conservative funders such as the Koch brothers and Bush economic advisor Keith Hennessey retreated from holding the debt ceiling hostage, probably realizing where the blame would lie should the US be forced into default…so by Thursday, word came from the house republicans, meeting at a plantation resort in Virginia, that they would vote on January 23 vote for a three-month extension of the debt limit with a rider to block pay for members of Congress if a budget wasnt passed during that interval…that would make the March 1st $600 billion sequestered budget cuts imposed by lat year’s Budget Control Act the next fiscal bridge to cross, which Goldman estimates could clip another 1% off of 2013 GDP…and in case anyone has forgotten, we dont have an official budget for this fiscal year yet, either, and the continuing resolution to fund the government at last year’s level that was signed in September expires on March 27th…

likely the most important data released this past week was the Advance Estimate of Retail Sales for December from the Census Bureau (pdf); although the january retail sales report will be the one to watch, since it will be the first one affected by the expiration of the payroll tax cut at year end, when all consumers except the wealthiest will see a 2% decrease in take-home pay…the seasonally adjusted U.S. retail and food services sales for December were estimated to be at $415.7 billion, which would be an increase of 0.5 percent (±0.5%)* from November and 4.7% (±0.7%) above the retail sales reported a year ago, which is not adjusted for inflation…total 2012 sales were up 5.2 percent (±0.6%) from 2011…much of the strength was in automotive sales; actual car & parts sales of $74.942 billion were adjusted to $78,082 billion to produce a month over month gain of 1.6% for that category; and car sales alone were 1.8% above November on a seasonally adjusted basis…ex-auto, retail sales were up 0.3% for the month…other than automotive, there was strength in restaurant & bar sales, which were up 1.2% for the month. and drugstore type goods, which posted a one month sales gain of 1.4%…on the other hand, sales at gasoline stations were down 1.6% and sales at electronics & appliance stores fell 0.6% from November; (note that appliance & electronic stores were coming off strong recent months, up 2.5% in November, and up 4.5% with the iphone5 release in september, so an adjustment was to be expected)…best sales gains on a year over year basis were seen by non-store retailers (online & catalog), which were up 12.6% over last December, and they saw total sales for 2012 rise to $439.530 billion, 11.6% higher that 2011; general merchandise stores saw a corresponding sales decline of 2.0% from last December, while annual sales were at $632.212 billion, only 0.5% better than 2011, while the subcategory of department stores saw a 0.3% gain over November but 1.7% less in annual sales than last year…remember that retail sales are not adjusted for changing prices, and as a result most charts on retail sales show a pretty steady growth as a result…but it’s also useful to look at retail sales adjusted for inflation, which doug short does in the adjacent chart; the top red graph shows the 153.3% gains in 20 years of retail sales as reported; while the lower red graph shows retail sales growth on a per capita basis; then the light blue graph line shows retail sales adjusted for price changes up just 52.1% over 20 years, and finally the dark blue graph, which adjusts retail sales for both inflation and for population growth, shows real per capital retail sales up just 23.2% over 20 years…
coincidental with the release of retail sales, although from a different agency, was the release of the Consumer Price Index for December from the BLS…the BLS reported that the seasonally adjusted change in the CPI (for all urban consumers, CPI-U) was virtually flat at 0.0% in December (works out to a -0.2% annualized rate); over the last 12 months, the all items index increased 1.7%, down from November’s 1.8% 12 month reading…a drop of 2.3% in the price of gasoline dragged the energy index to a 1.2% loss, and that in turn offset increases in other indexes, notably the food index, which was 0.2% higher, and shelter, which increased 0.1%…in addition to shelter, the indexes for transportation services increased 0.5%, and for medical care was up 0.3%, while indexes for recreation, household furnishings and operations, and used cars and trucks all declined in December…the core CPI, which is the index for all items less food and energy increased 0.1 percent in December, the same increase as in November; the one year increase in the Core-CPI has been 1.9%….gasoline was the only energy index to decline; the index for natural gas increased 1.3% and the electricity was up 0.2%…within the food category, five of the six major grocery store food groups increased, with only meat, poultry and fish holding steady. as the food at home index rose for the third consecutive month. over the entire year, the CPI has risen 1.7% after a 3.0% increase in 2011; over the past ten years the all items index has seen a 2.4 percent average annual increase…for 2012, the food price index has been up 1.8%, the energy index fell 0.5% (as energy services – electricity and piped gas – fell 1.1%); shelter rose 2.2%, new cars rose 1.6% but used cars fell 2.0%, transportation services rose 2.6%, clothing was up 1.8%, and the medical care index rose 3.2 percent as drugs rose 1.7% and services rose 3.7%…the chart we have here from doug short shows the cumulative change in each of eight major components of the CPI since 2000; the steady rise of medical care, shown by red, is obvious, as is the lack anything but seasonal changes in the clothing index, shown in orange…the widely volatile green line is the transportation index, which includes gasoline…

along with retail sales, another report used in official recession calls out this week was on Industrial Production and Capacity Utilization for December from the Fed; after a relatively sharp rise of 1.0% (revised) in November as east coast industry rebounded after Sandy, industrial production settled in at a modest 0.3% increase in December; combined with the Sandy related weak October, total production increased at an annual rate of 1.0 percent in the 4th quarter…manufacturing output increased 0.8% in December after a 1.3% rebound in November, but for the quarter, production barely at an annual rate of 0.2 percent…output of mines rose 0.6% in December, but output of utilities fell 4.8% on a seasonally adjusted basis because a warmer than normal December reduced the need for heating…among marketing groups, the output of consumer goods fell 0.1% in December and declined at an annual rate of 0.9% in the fourth quarter; the production of durable consumer goods increased 1.2%, as increases in output of automotive products and home electronics more than offset declines in the indexes for appliances, furniture, carpeting and miscellaneous durable goods…the output of nondurable consumer goods decreased 0.5%, concentrated in the production of consumer energy products, which fell 4.4%…production of business equipment increased 1.3% in December following a increase of 2.0% in November, but it was little changed for the fourth quarter as a whole….also over the fourth quarter, the production of transit equipment increased at an annual rate of 6.5%, while indexes both for information processing equipment and for other industrial equipment decreased at an annual rate of 2.3 percent…
capacity utilization for total industry in December just increased by 0.1%, to 78.8%; the factory operating rate rose to 77.4%, a rate 1.4 percentage points below its long-run average…the percentage of durable goods manufacturing being used in December was 77.8%, while capacity utilization for nondurable manufacturing was 78.3 percent, a rate 2.6 percentage points below its long-run average; the output of nondurables rose 0.6 percent in December, but it was down at an annual rate of 0.6 percent in the fourth quarter…capacity utilization at mines in December moved up 0.4% to 91.9 percent, a rate 4.6 percentage points above its long-term average; however, the operating rate for utilities fell 3.8 percentage points to a seasonally adjusted 71.8%, a rate 14.5 percentage points below its long-run average, as a warmer than normal december had utilities operating below capacity…the FRED generated chart that we have included here shows industrial production since 2000 over the 3 major industry groups (the Fed generates an index, now set to 2007 =100, for each category) monthly output for manufacturing is shown in blue, monthly output from electric and gas ultites is tracked by the green graph, and output from mines, including oil & gas, is shown in red.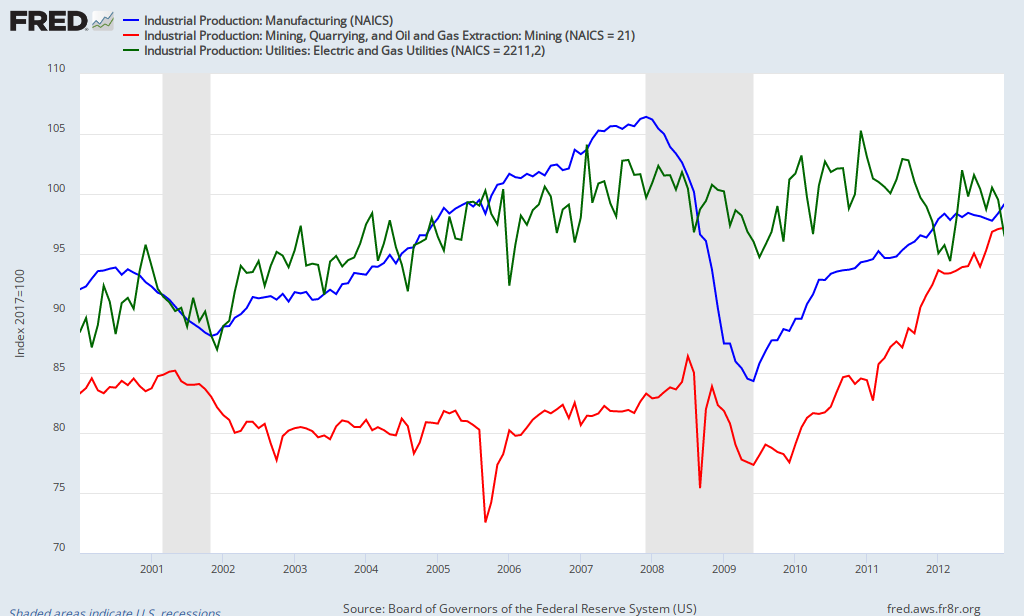
there were also a few reports on housing, covered in a review fashion by Bill McBride…one that garnered a lot of media attention was new housing starts for December, which were at a 4 year high…the data comes from the New Residential Construction report from the Census Bureau, and much like other reports on housing from the Census, this report has a wide margin of error, which is never reported by the media…as reported, private housing starts in December were estimated to be at a seasonally adjusted annual rate of 954,000, which was 12.1 percent (±13.4%)* over November’s level; that means the bureau is 90% confident that the number of new housing starts in December had fallen somewhere between an annual rate of 826,164 and 1,081.836; likely up from the number in November but by no means certain…the annual increase was reported to be 36.9 percent (±22.0%) above the December 2011 rate of 697,000, certainly up, but with even a greater degree of uncertain range than the monthly numbers…so although we’re willing to make note of this, a better marker for tracking the home building market is likely the new residential component of GDP, which will be released at the end of the month….and even then we will have to question the seasonal adjustment, since this past December has been one of the ten warmest on record, which likely allowed for more home building activity than the baseline December would have generated…this residential construction report is still useful, however, as a window into new construction authorized by building permits; for December, they were at a seasonally adjusted annual rate of 903,000. which was 0.3 percent (±1.0%)* above the revised 900,000 permits issued in November, and was 28.8 percent (±1.4%) above the estimate of 701,000 from December a year ago…
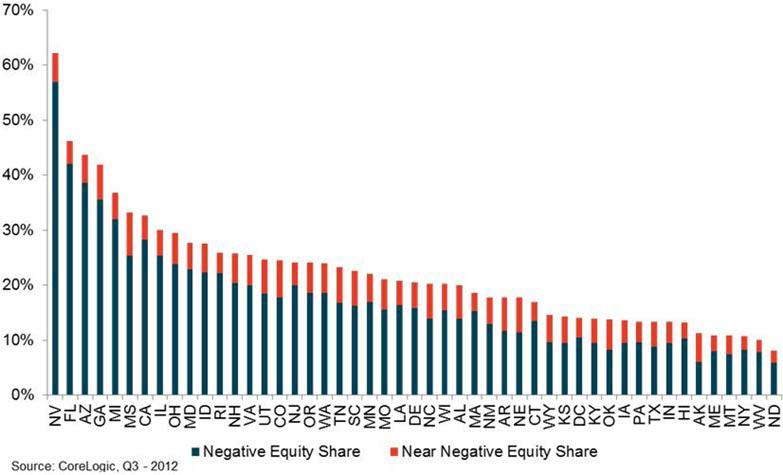 there were also a few reports from housing data analytics firm CoreLogic out this week; the first was the Negative Equity Report for the 3rd quarter; their latest analysis showed approximately 100,000 more homeowners were no longer underwater, or in a situation where they owed more on their mortgage than their house was worth, at the end of the 3rd quartet than had positive equity at the end of the second quarter; that brought the year to date number of borrowers whose equity turned positive in 2012 to 1.4 million, leaving 10.7 million homeowners, or 22 percent of all residential properties with a mortgage, still in negative equity at the end of the third quarter; in addition, CoreLogic found that an additional 2.3 million borrowers had less than 5 percent equity in their home, which they call near-negative equity, at the end of the third quarter….5 states combined accounted for 34% of the negative equity homes in the US: Nevada had the highest percentage of negative equity mortgages with 56.9%, followed by Florida, where 42.1% remained underwater, Arizona, where negative equity was at 38.6 percent), Georgia, where it was at 35.6 percent, and Michigan, where 32% of homeowners remained underwater…the above chart from CoreLogic shows the percentage of negative equity mortgages by state in dark blue on the bars, and includes the percentage of “near negative equity” in the orange extensions…CoreLogic also released their November Home Price Index, which is a weighted average of prices for homes sold over 3 months with most recent sales counting more; the index was up 0.3% over October with this report, and home prices nationwide, including those from distressed sales, increased on a year-over-year basis by 7.4% in November, the ninth consecutive increase in home prices nationally and the greatest year over year increase in prices since May 2006….
 one infrequently covered release that we normally review is the Mortgage Monitor for November from LPS (pdf); LPS (Lender Processing Services) reports that 1,767,000 home loans were in the foreclosure process in November, which was 3.51% of all mortgages, and down from 3.61% of the total outstanding in October; foreclosures were said to be held up by the adoption of the national mortgage settlement requirements, and are expected to pick up again now that theyre in place; Florida, with 11.8% in foreclosure, remains the state with the largest foreclosure backlog…LPS also reported that 7.12% of mortgages were delinquent but not in foreclosure in November, up from 7.03% in October; of these, 1,999,000 mortgage loans were more than 30 days and less than 90 days past due, and another 1,584,000 loans were 90 or more days delinquent.…although overall delinquencies increased, the longer term delinquencies decreased, while those less than 90 days past due jumped from 3,500,000 in October, which is indicative of a normal seasonal trend that occurs before the holidays as homeowners forego a housepayment or two during the shopping season, then catch up on their mortgage payments by march…in addition, LPS also noted that there was a 15% increase in delinquencies in the zip codes impacted by Sandy in New York, New Jersey, and Connecticut (shown on page 7, pdf)…the states showing the highest percentages of non-current mortgage loans in November were Florida with 19.7%, New Jersey with 16.8%, Mississippi with 16.7, Nevada with 15.1%, and New York, where 13.8% of mortgage loans were past due; New Jersey, with a 7.1% jump, has seen the largest year over year increase in delinquent mortgages; while Arizona has the greatest mortgage cure rate, with 30.8% of those delinquent a year ago either paid up or foreclosed on…a table with percentages non-current, in foreclosure, and the YoY change in mortgage delinquencies for all 50 states and the DofC can be found on page 19 of the pdf…the chart included here above (from p4 of the pdf) shows the percentage of homes in the foreclosure process monthly since january 1995 in green, with the recent downturn showing the effect of the current hiatus in foreclosure starts, while the servicers were responding to requirements of the foreclosure fraud settlement; the red line shows the additional percentage of non-current loans that are not in foreclosure; the aforementioned seasonally, werein mortgage delinquencies rise in the fall and are cured in the new year is apparent well before the housing bust, shown by small rising blue arrows…
(the above is my weekly commentary that accompanied my sunday morning links emailing, which in turn was mostly selected from my weekly blog post on the global glass onion, and also includes other links of interest…if you’d be interested in getting my weekly emailing of selected links that accompanies these commentaries, most coming from the aforementioned GGO posts, contact me…)
